Learn how we calculate your Smarts reports
Please note that this article was written in 2013 and may now be outdated.
This post explains how we calculate the data for Analytics reports.
Your Local Market
We start with quotes you’ve sent through the site in the last 31 days, and find businesses who quoted on the same jobs as you. For the Analytics reports, this is Your Local Market – it’s who we compare your performance with.
Market Prices
For this report we compare you to businesses in your local market who quoted on the exact same jobs using exactly the same price type. By matching both job and price-type we compare “apples with apples” and the comparison is meaningful.
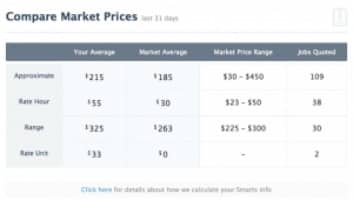
Example of an Analytics Market Price report
Your Average Price is your median price for each price type*. The Market Average Price is the median price quoted by your competitors. The Market Price Range shows the low and high median prices for your competitors. Your quotes don’t get counted in the Market Average or Price Range. This stops really heavy users from skewing the averages and lets you to make a genuine comparison between your prices and theirs.
*For “Range” quotes we calculate the mean price from the low and prices in each range – e.g. (low + high) divided by 2 – then work out the median.
Quote Speed
Compared to Pricing, this is very straight forward. Quote Speed is the time between when a job was posted and when you quoted. We calculate the Quote Speed for every quote you submitted, and do the same for your competitors.
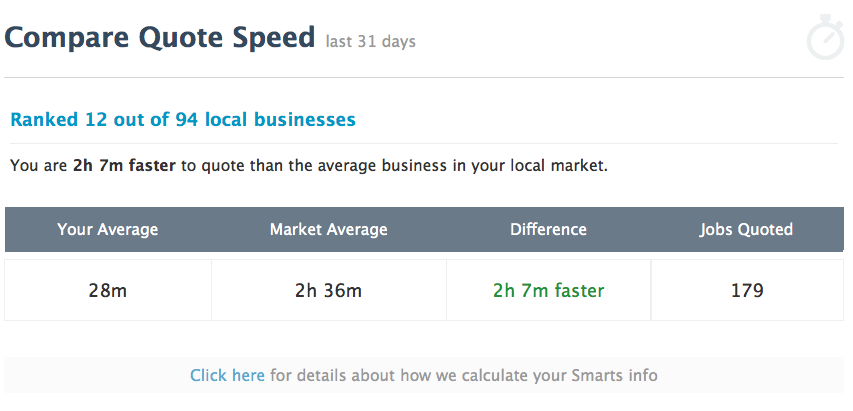
Example of an Analytics Quote Speed Report
Your Average Speed is your median time across all quotes, and the Market Average is the market median. For this measure we give you a ranking against everyone in your local market.
Proximity
This follows the same method as Quote Speed, except we measure the distance in kms between you and the customer who posted the job to calculate the medians and ranking.
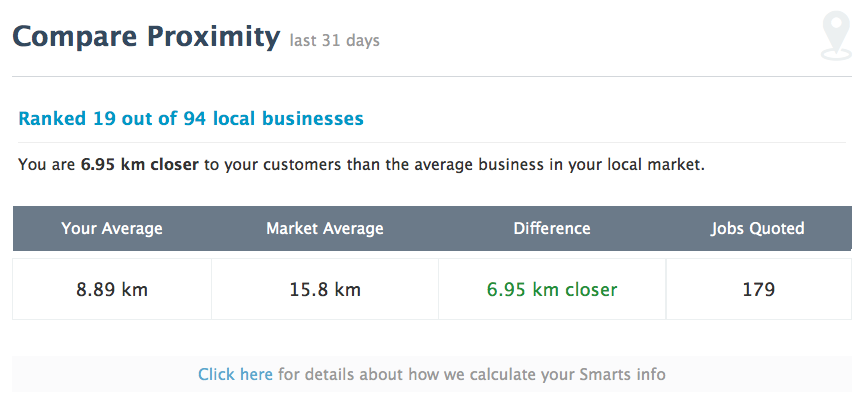
Example of an Analytics Proximity Report
Reviews & Ratings
For these we rank your competitors by their current Review count and feedback Rating %. Your Average scores are your current Review count and your current % Rating. The scores are the median Review count or current Rating for your competitors. We don’t work out what the Review count or rating was at the time each bid was submitted.
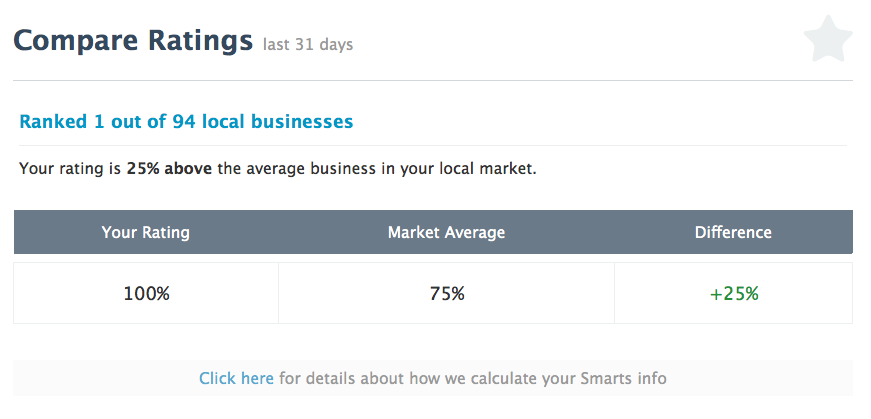
Example of an Analytics Feedback Rating report
Which Businesses Can Use Analytics
Any business who has quoted in the last 31 days can Get an Analytics Membership and get access to comparison reports.
The reports are designed to give the most benefit to regular users who are very active in big local markets. If you are in a major city and quote a few times each week on the site, you’ll get a lot out of the Analytics reports. If you are in a regional area, or quote once or twice a month, it is probably not for you.
Situations Where Analytics Doesn’t Work
There are several situations where Analytics reports won’t work as intended.
- No Recent Quotes: If you haven’t quoted in the last 31 days you won’t see any data.
- Your Local Market is Small: If you only quote a few times a month, there are only a few leads in your area, or you have no competitors, you’ll see reports, but you probably won’t get meaningful comparative data
- Poor Quality Quotes: You’ll see odd results in the Market Pricing reports if you quote using the wrong price types or submit inaccurate quotes.
- National Coverage: If your business has a national or state-wide footprint, your Proximity rank will naturally be low. The reports are geared to help smaller local businesses moreso than national companies.